What Is a Call Centre Wallboard and What Belongs on It?
By Jamila Parker · · 7 min read

A call centre wallboard gives teams a real-time view of queues, service levels, agent activity and workload. Learn which metrics belong on a useful wallboard and which ones should stay out.
Key takeaways
- A call centre wallboard is a live operational view, not a replacement for every report.
- Calls waiting, service level, answer speed, abandonment and agent status are core real-time metrics.
- AHT and FCR can add useful context when they support the team's goals.
- Keep the screen simple and focus on metrics that lead to an action.
- Avoid turning the wallboard into a public performance-ranking board.
What Is a Call Centre Wallboard?
A call centre wallboard is a real-time visual dashboard that shows important contact centre information in a format agents and supervisors can understand quickly. Instead of opening several reports or waiting for an end-of-day summary, the team can see what is happening now how many customers are waiting, how long calls are taking, whether service levels are being met and which agents are available.
Modern wallboards can pull live information from telephony platforms, automatic call distributors (ACDs), customer relationship management (CRM) systems and other contact centre tools. The information is usually displayed on a large screen in the office, but cloud-based teams can also use browser dashboards on laptops or monitors.
The purpose is not to put every available metric on one screen. A useful call centre wallboard highlights the small set of operational signals that help a team respond quickly. If the queue is growing, supervisors can review staffing or routing. If service level is falling, they can investigate the cause before the problem becomes a customer experience issue.
Why Do Call Centres Use Wallboards?
The main advantage of a wallboard is shared visibility. Agents, team leaders and managers can work from the same live information instead of relying on different reports. This can make operational decisions faster especially during busy periods.
Wallboards can also make performance trends easier to notice. A queue that normally contains a few calls but suddenly increases is visible immediately. The same applies to rising abandonment, longer average speed of answer or changes in agent availability.
However, visibility should support action rather than create pressure. Displaying too many individual rankings can distract agents from customer conversations or encourage people to optimise a single number instead of delivering a good overall customer experience.
What Belongs on a Call Centre Wallboard?
1. Calls Waiting and Queue Length
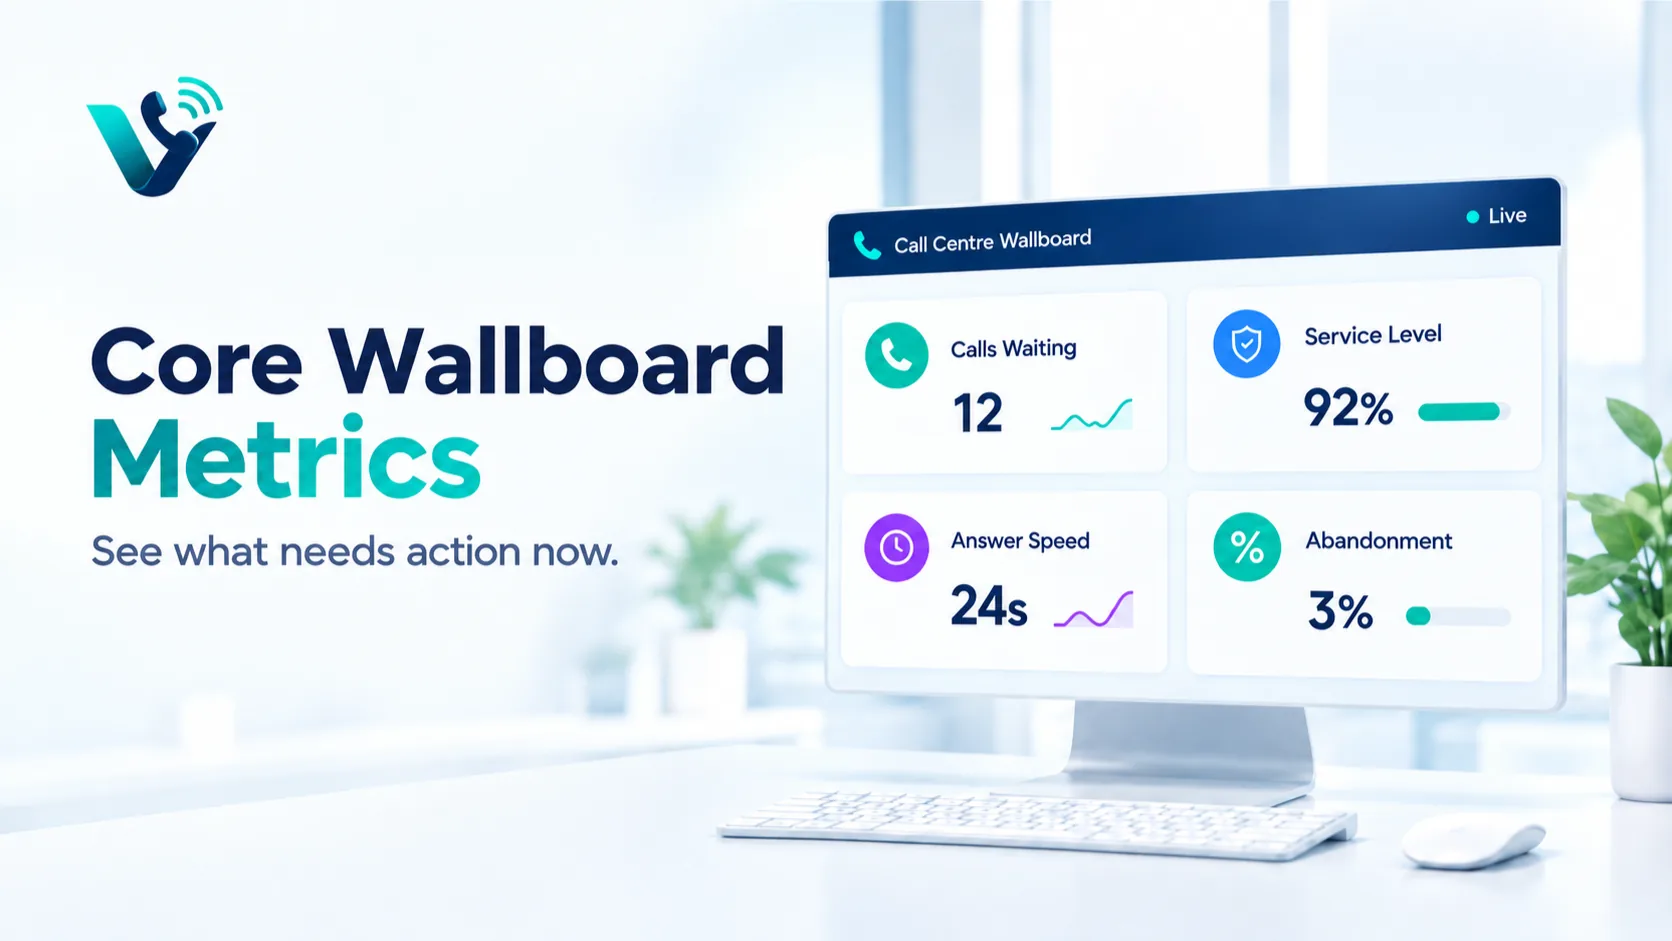
Calls waiting is one of the clearest real-time indicators for an inbound contact centre. It shows how many customers are currently waiting to speak with an agent. Queue length gives supervisors an immediate view of demand and can help them recognise unusual spikes.
For a busy support team, this metric is most useful when paired with a target or normal operating range. A raw number without context can be difficult to interpret. For example, ten calls waiting may be normal for one team and a serious service issue for another.
2. Service Level
Service level shows whether calls are being answered within the target time agreed by the organisation. It is one of the most useful wallboard metrics because it connects live operational activity with a customer-facing service objective.
A wallboard should make service level easy to understand at a glance. Supervisors can then investigate whether a change is linked to call volume, staffing, routing, breaks or another operational factor.
3. Average Speed of Answer
Average Speed of Answer (ASA) measures how long customers wait before an agent answers. It provides more detail than queue length alone. A queue may look manageable while customers are still waiting longer than expected if available agents are handling complex calls.
ASA is particularly useful alongside service level and abandonment rate. Looking at the three together gives a more complete picture of the customer waiting experience.
4. Abandonment Rate
Abandonment rate shows the proportion of callers who leave the queue before reaching an agent. A rising abandonment rate can indicate that customers are waiting too long or that the queue is not being managed effectively.
This metric should not be interpreted in isolation. Some callers may abandon very quickly because they dialled by mistake, while others may leave after a long wait. The team should look at the timing and circumstances behind the number.
5. Agent Status and Availability
Agent status helps supervisors understand how many team members are available, on a call, in after-call work, on a break or otherwise unavailable. This is particularly valuable when the wallboard is used for live workforce management.
The goal should be operational awareness, not constant surveillance. A simple status view can help a supervisor identify a staffing gap without turning the wallboard into a public leaderboard.
6. Average Handle Time
Average Handle Time (AHT) measures the average time agents spend handling customer interactions, including relevant after-call work depending on how the system defines the metric.
AHT can help identify changes in workload and call complexity. But a lower AHT is not automatically better. Rushing customers off the phone can reduce the number but damage resolution quality and customer satisfaction. For that reason, AHT works best when viewed with other service and quality measures.
7. First Call Resolution
First Call Resolution (FCR) indicates whether customers issues are resolved during the first interaction. When available in real time or near real time, it can add useful context to operational performance.
FCR is especially valuable for support teams because it focuses on the outcome of the interaction rather than only how quickly the call was handled.
8. Alerts and Exceptions
A good wallboard can also highlight exceptions that require attention. Examples include an unusually long queue, a sudden fall in service level, a high abandonment rate or insufficient agent availability.
Alerts should be limited to conditions that require action. If everything is highlighted, nothing feels important. The best design makes the urgent information visually obvious without turning the screen into a collection of warnings.
What Should Stay Off the Wallboard?
A wallboard should not become a complete reporting dashboard. Detailed revenue reports, long-term trend analysis, large tables, complex customer records and every available agent statistic usually belong in dedicated reports or manager dashboards.
Individual performance rankings also need careful consideration. Publicly displaying names with negative performance indicators can create unnecessary pressure and may encourage behaviour that improves the displayed metric rather than the customer experience.
The rule is simple if a metric does not help someone make a decision during the current operating period, it probably does not belong on the main wallboard.
Try this on your own numbers
Local numbers in 118 countries, AI call notes and one shared inbox. Live the same day, no contract.
How to Design a Useful Call Centre Wallboard
Start with the decisions the team needs to make. If supervisors need to respond to queue growth, prioritise calls waiting, service level, ASA, abandonment and agent availability. If the environment is primarily outbound sales, the relevant live measures may be different.
Keep the layout simple. Use clear labels, large numbers and a small number of visual states. Avoid forcing agents to interpret complicated charts while they are handling customers.
The wallboard should also match the team's operating rhythm. Real-time metrics are useful for immediate action, while weekly or monthly trends are better handled in management reports. Mixing both on one screen can reduce clarity.
Finally, review the wallboard regularly. A metric that was useful six months ago may no longer support the team's current workflow. The display should evolve as staffing, customer demand, channels and service goals change.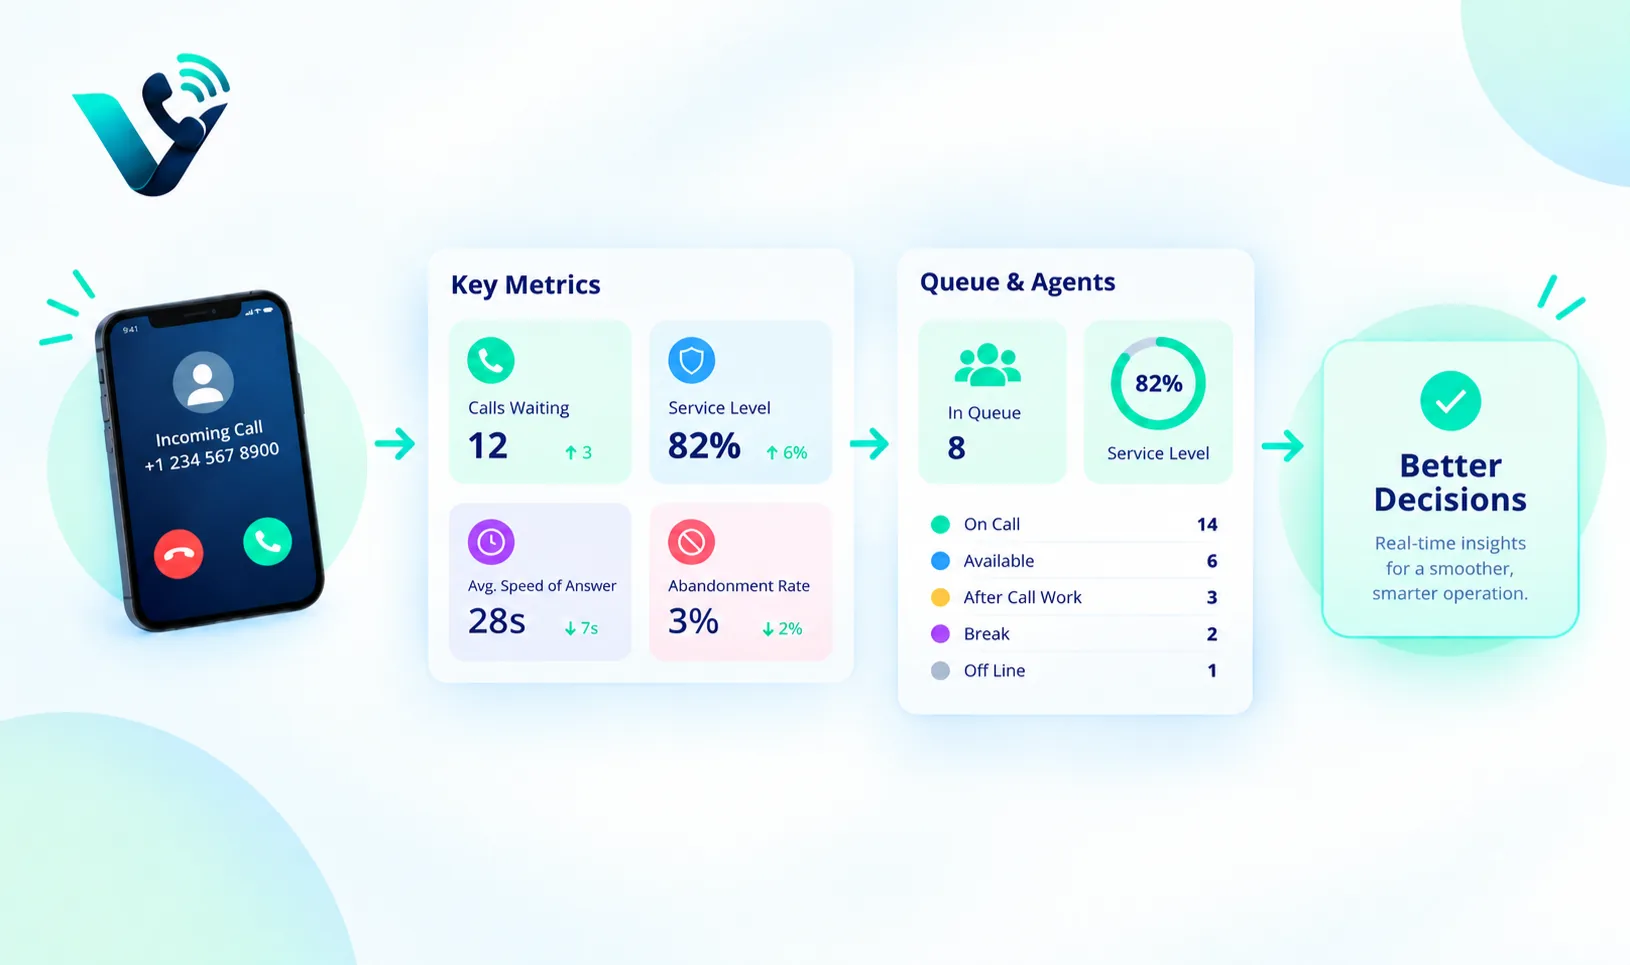
Call Centre Wallboard KPI Example
Metric |
Why it matters |
Use on wallboard |
Calls waiting |
Shows current queue pressure |
Yes |
Service level |
Shows whether response targets are being met |
Yes |
Average speed of answer |
Shows customer waiting time |
Yes |
Abandonment rate |
Shows callers leaving before answer |
Yes |
Agent status |
Shows available operational capacity |
Yes |
Average handle time |
Shows handling workload |
Usually |
FCR |
Shows resolution quality |
When available |
Detailed revenue reports |
Better for management analysis |
No |
Frequently asked questions
- What is a call centre wallboard?
- A call centre wallboard is a live visual dashboard that displays important contact centre metrics such as queue length, service level, answer speed and agent status.
- What should be displayed on a call centre wallboard?
- Common metrics include calls waiting, service level, average speed of answer, abandonment rate and agent availability. Other measures can be added when they support live operational decisions.
- Why is service level important on a wallboard?
- Service level shows whether customer calls are being answered within the organisation's target time, making it useful for live service monitoring.
- Should average handle time be on a wallboard?
- It can be useful, especially for workload monitoring, but it should be interpreted alongside service and quality metrics rather than treated as a standalone target.
- Should individual agent rankings be displayed?
- Not necessarily. Public rankings can create unwanted pressure and may encourage agents to optimise one metric instead of focusing on customer outcomes.
- Can remote teams use a call centre wallboard?
- Yes. Cloud-based contact centre platforms can provide browser-based dashboards so distributed teams and supervisors can access live operational information.