Average Speed of Answer: What It Measures and How to Improve It
By Jamila Parker · · 7 min read

average speed of answer (ASA), how it is calculated, what affects it, and how to reduce caller wait without damaging service quality.
Key takeaways
- A basic formula is total waiting time for answered calls divided by the number of answered calls.
- High arrival volume, insufficient staffing and long handle times are common causes.
- Align staffing to arrival patterns, simplify unnecessary IVR branches and use overflow rules so calls can reach other qualified agents when primary teams are busy..
- Pushing agents to answer instantly can create pressure without solving the underlying service issue.
- Measure the result after implementation and adjust the workflow using real customer and call data.
Average speed of answer, usually shortened to ASA, measures how long callers wait before an agent answers. It is one of the clearest measures of queue responsiveness. Genesys defines ASA as the average time from an interaction entering the management system until it is delivered to an endpoint, with implementations often focusing on queue wait before an agent becomes available.
Votelly context: For contact-center reporting, phone data becomes more useful when the same queue definitions and call-handling rules are used consistently, so managers can compare performance over time instead of comparing mismatched metrics. Explore Votelly
ASA Formula And Reporting Choices
A basic formula is total waiting time for answered calls divided by the number of answered calls. Some systems handle abandoned calls, IVR time or transfers differently, so document the reporting definition used in your platform.
Operationally, this is where asa formula and reporting choices becomes measurable rather than theoretical. Map the current process first, then change one variable at a time so the team can see whether the new approach improves responsiveness, conversion or customer effort.
Comparisons are most useful when the same definition is used over time and when results are viewed by queue and interval rather than only as a monthly average.
A useful way to apply this is to test the rule on a defined segment instead of changing every call flow at once. For average speed of answer, a controlled rollout makes it easier to spot edge cases, compare before-and-after results and correct problems before scale adds complexity.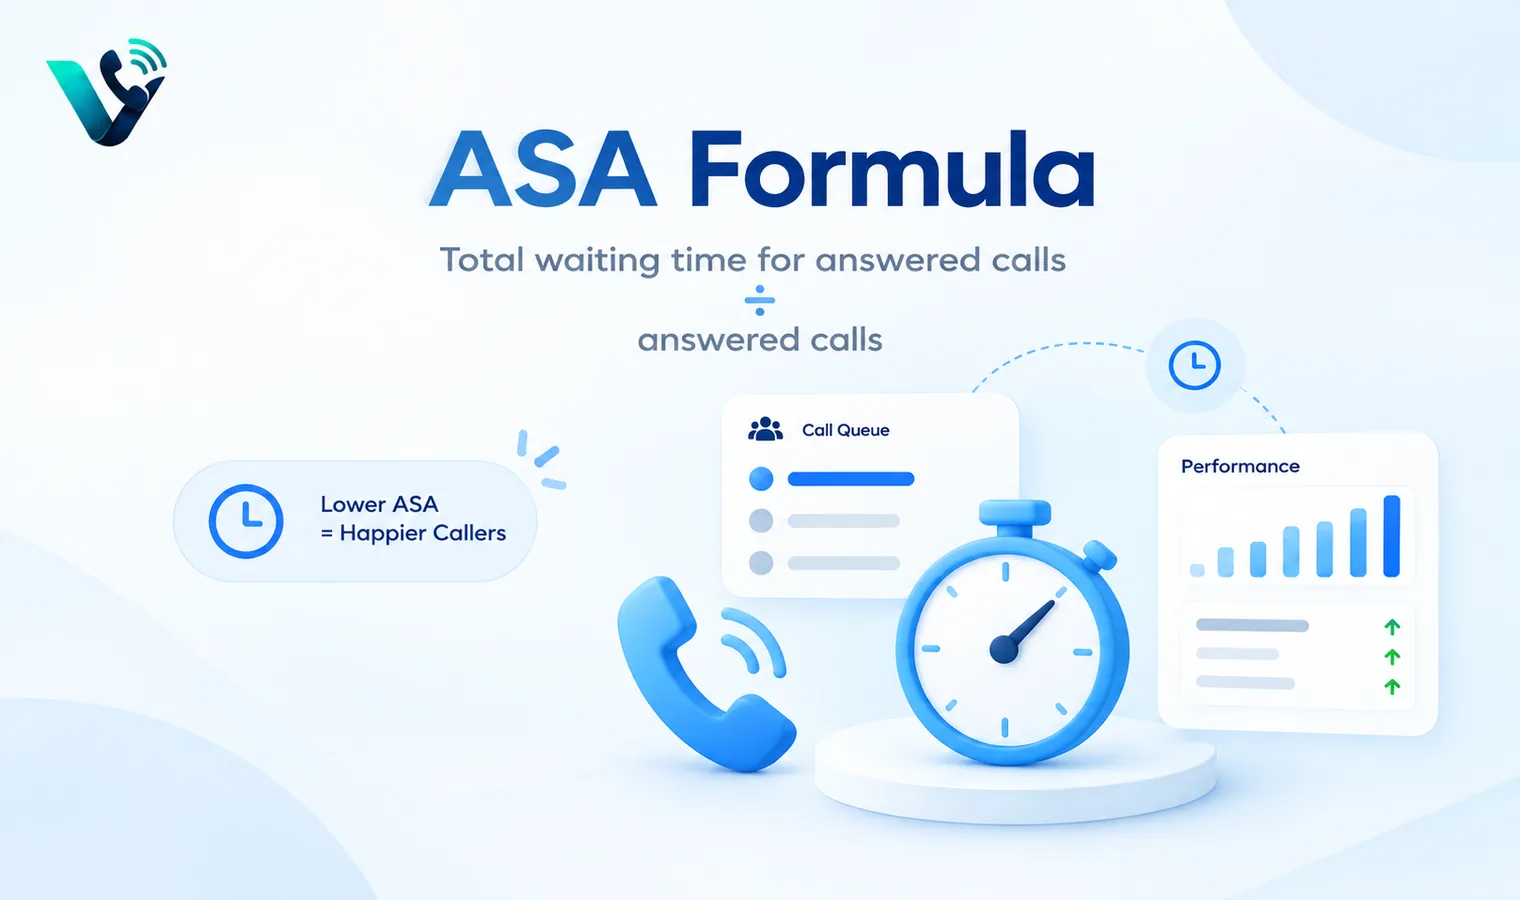
Practical note: Set a baseline before changing the workflow so the impact can be measured rather than guessed.
What Drives A High ASA
High arrival volume, insufficient staffing and long handle times are common causes. Routing errors can also leave available agents idle while a queue grows elsewhere.
The customer impact should stay visible in the decision. Ask what the caller or prospect experiences before, during and after the call, then make sure the configuration supports that journey rather than only making the internal workflow look efficient.
Unexpected events create short-term spikes, but recurring spikes at the same time each day usually point to a forecasting or scheduling issue.
For managers, the important step is ownership: Decide who monitors the result, which threshold triggers a review and what fallback applies when the preferred path is unavailable. That turns what drives a high asa into a repeatable operating process.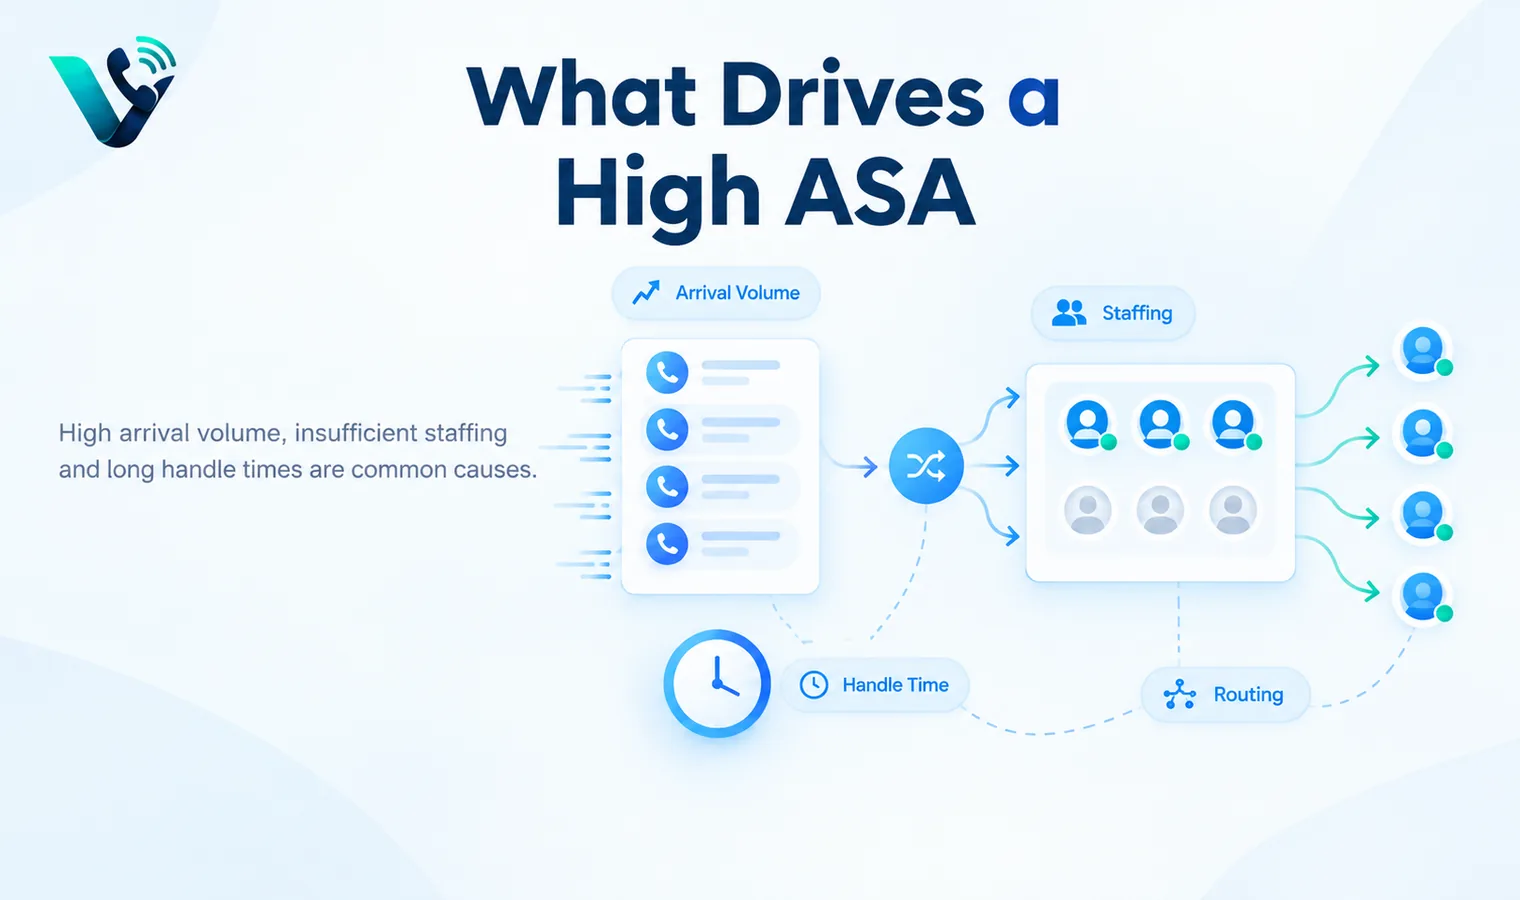
Practical note: Write down the fallback path before launch; edge cases are easier to handle when ownership is clear.
How To Improve ASA
Align staffing to arrival patterns, simplify unnecessary IVR branches and use overflow rules so calls can reach other qualified agents when primary teams are busy.
Data quality can change the result as much as the phone setting itself. Verify contact details, agent availability and routing inputs before judging performance; otherwise the team may blame average speed of answer for a problem created by incomplete or inconsistent data.
Offer callbacks for long waits and improve agent access to customer information so handling does not become slow because of tool switching.
Avoid optimizing this in isolation. Pair the primary metric with a customer-outcome measure so improvements in speed or volume do not quietly increase transfers, repeat contacts, missed calls or low-quality conversations.
Practical note: Test the experience from the caller side as well as the agent side before expanding the change.
Do Not Optimize ASA Alone
Pushing agents to answer instantly can create pressure without solving the underlying service issue. If speed improves while first contact resolution falls, customers may call back more often.
The safest implementation is incremental. Define the desired outcome, test the behavior with real traffic, collect agent feedback, and keep the rollback path simple. Once the workflow is stable, expand it to additional teams or markets.
Balance ASA with service level, abandonment, FCR, quality scores and customer satisfaction.
This decision also needs a clear exception path. Calls rarely behave exactly as planned, so document what happens during peaks, after hours, on failed connections and when no suitably available agent can take the interaction.
Practical note: Keep the first rollout narrow enough that the team can identify the cause of any improvement or regression.
Set Targets By Queue
A sales inquiry queue and a technical support queue may need different targets because caller expectations and complexity differ.
Operationally, this is where set targets by queue becomes measurable rather than theoretical. Map the current process first, then change one variable at a time so the team can see whether the new approach improves responsiveness, conversion or customer effort.
Set a target range, monitor distribution and review the worst intervals. The average becomes more actionable when managers can see when and where it is being missed.
A useful way to apply this is to test the rule on a defined segment instead of changing every call flow at once. For average speed of answer, a controlled rollout makes it easier to spot edge cases, compare before-and-after results and correct problems before scale adds complexity.
Practical note: Review the result by time window, queue or segment so a good average does not hide a weak customer experience.
How To Apply This With Votelly
Translate the idea into a simple operating rule: Decide which number receives or presents the call, who should handle it, what happens when the preferred path is unavailable, and which outcome will be reviewed after launch. Votelly can act as the cloud calling layer while your CRM or support workflow keeps customer context and follow-up connected. For customer-facing service planning, also review the customer support page.
Implementation Checklist
- Define which queues and opening hours the ASA target applies to, because sales, support and priority lines may need different response expectations.
- Measure call-arrival patterns in short intervals so staffing decisions reflect the actual peaks rather than a daily or monthly average.
- Check IVR paths and routing rules for unnecessary steps, loops or skills restrictions that leave callers waiting while qualified agents are available elsewhere.
- Create overflow rules for busy periods and define when calls should move to another qualified team, callback option or alternative handling path.
- Monitor abandonment rate and service level together with ASA so a better average does not hide callers who wait too long and disconnect.
- Test queue announcements and callback options from the caller side, including what happens during peaks, after hours and when no agent becomes available.
- Review staffing schedules against recurring ASA spikes and adjust coverage before adding more routing complexity or changing the target itself.
30-Day Measurement Plan
Days 1-7: Record ASA by queue in consistent 15- or 30-minute intervals and map the result against call arrivals, available agents, abandonment and service level. Identify the specific periods where waits rise rather than relying on one overall average. Note any IVR or routing behavior that adds delay before a caller reaches the intended queue.
Days 8-21: Test targeted changes during the problem intervals-for example schedule adjustments, simpler IVR choices, overflow routing or a callback option-and compare ASA, abandonment and service level before and after each change. Days 22-30: Review the worst intervals again, confirm whether the improvement holds on normal and busy days, and document the staffing or routing rule that should become standard for each queue.
Try this on your own numbers
Local numbers in 118 countries, AI call notes and one shared inbox. Live the same day, no contract.
Common Mistakes To Avoid
- Using a monthly ASA average that hides short periods of severe queue congestion and long caller waits.
- Lowering the ASA target without checking whether the current staffing level can realistically support it during peak arrival periods.
- Adding more IVR choices or routing conditions in an attempt to improve speed, even though the extra steps can delay callers further.
- Watching ASA alone while abandonment rises, service level falls or callers repeatedly move between queues.
- Applying the same response target to every queue instead of considering caller urgency, business hours, call purpose and available skills.
Conclusion
Average speed of answer is a queue-access metric: it shows how quickly callers can reach an agent, not whether the entire interaction was successful. Use it to locate specific periods where demand, staffing or routing are out of balance, then verify improvements with abandonment and service-level data. A useful ASA target should make waiting more predictable for callers while remaining realistic for the capacity and purpose of each queue.
Frequently asked questions
- What is average speed of answer?
- Average speed of answer is the topic covered in this guide. In practice, the exact setup or calculation depends on the phone system, market, queue design and the business process around it.
- What is the main business benefit of average speed of answer?
- The main benefit is better control over how calls are placed, answered, distributed or measured, which can reduce avoidable friction for customers and teams.
- What should I check before changing average speed of answer?
- Review the current process, the customer journey and the data related to asa formula and reporting choices. Confirm any number, privacy or caller-ID requirements that apply to your market before rollout.
- How should I measure whether average speed of answer is working?
- Choose metrics that match the objective. Depending on the topic, that may include answer rate, ASA, service level, abandonment, transfers, repeat contacts, qualified conversations or conversion.
- Can a small business use average speed of answer?
- Usually, yes, but the simplest configuration is often the best starting point. Small teams should avoid adding routing or automation complexity that they do not yet need.
- Can Votelly support a average speed of answer workflow?
- Votelly is designed around cloud business calling and number management. Check the live product and country availability for the exact feature, number type or routing behavior you plan to use.