Talk-to-listen ratio and the other metrics that predict a close
By Jamila Parker · · 8 min read

Talk-to-listen ratio is useful, but it is not a magic close-rate formula. Combine it with monologue length, question quality, buyer engagement and next-step discipline.
Key takeaways
- Talk-to-listen ratio is a diagnostic signal, not a universal closing target.
- Gong’s refreshed analysis of 326,000 calls found reps talked about 57% on won calls and 62% on lost calls, while the overall average was 60%.
- Long monologues, weak question quality and low buyer participation can reveal conversation problems that a single talk ratio hides.
- The right ratio changes by call type: cold calls, discovery calls, demos and negotiations require different amounts of seller explanation.
- The best coaching combines conversation metrics with a concrete next step and downstream deal outcomes.
Talk-to-listen ratio is one of the most recognisable sales call metrics because it turns a simple coaching idea into a number: How much of the conversation belongs to the seller, and how much belongs to the buyer. The metric is useful, but sales teams often ask it to do too much. A 45% seller talk ratio does not prove the rep listened well, discovered a real problem or earned a next step. A 60% ratio does not automatically mean the rep dominated the conversation. The context of the call matters.
What the current talk-to-listen data actually says
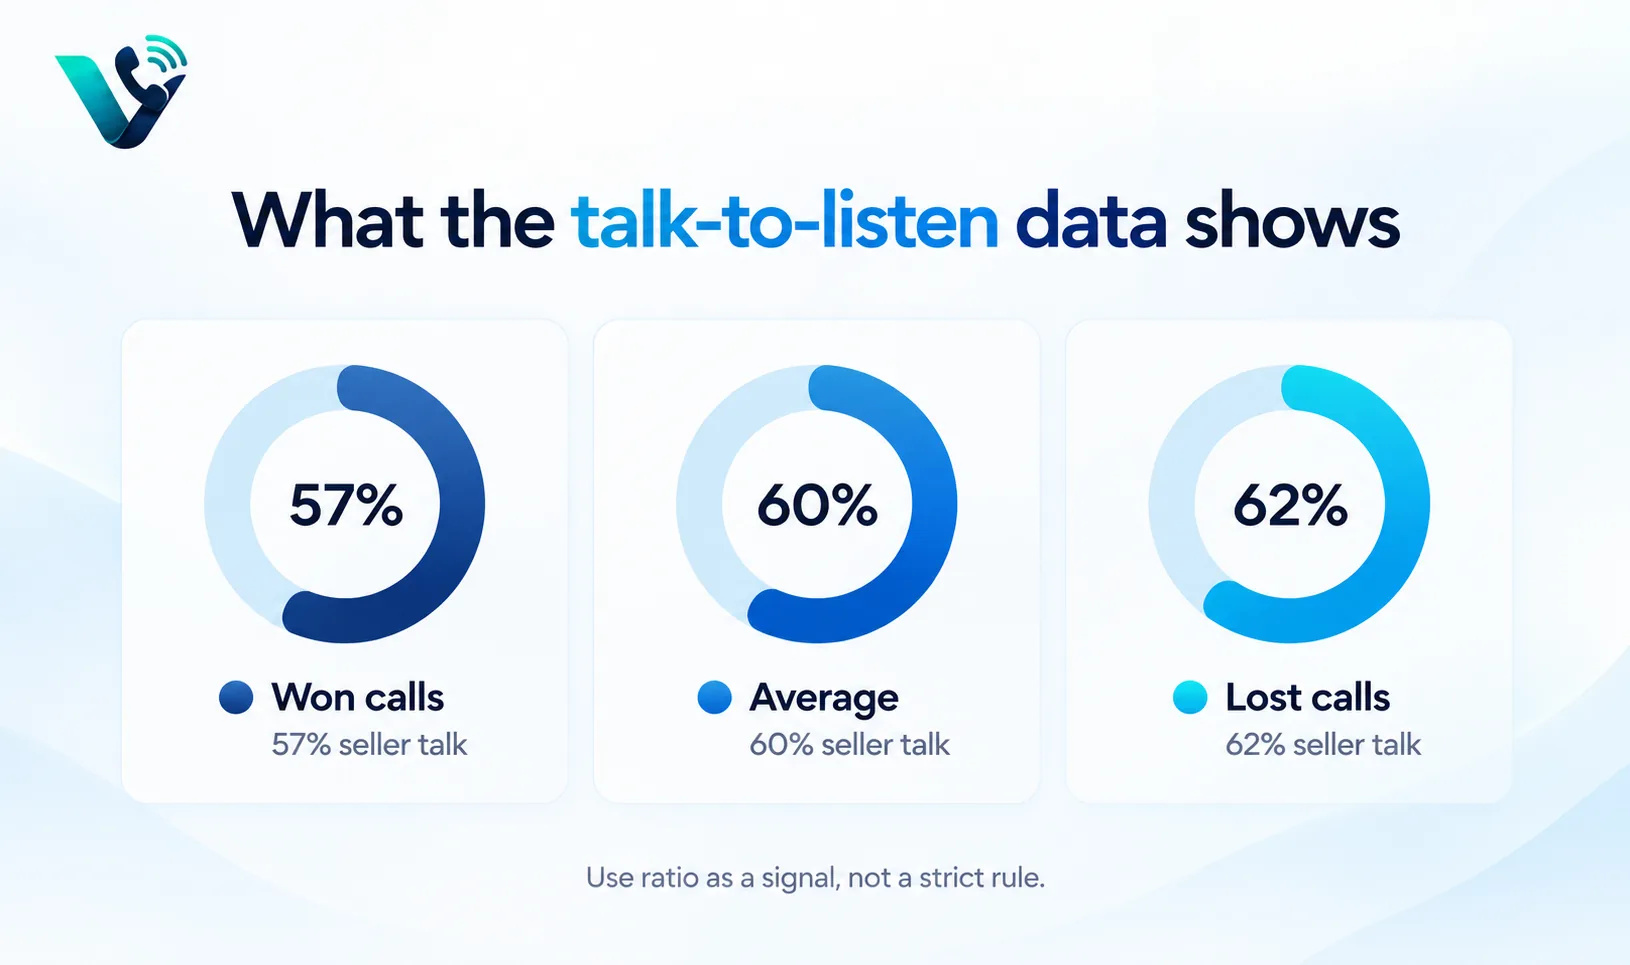
Gong refreshed its talk-ratio analysis using 326,000 sales calls of at least ten minutes. The overall average was about 60% seller talk and 40% buyer talk. On closed-won calls, sellers talked about 57% of the time; on lost calls, they talked about 62%. That is a meaningful directional difference, but it is not a giant gap and it should not be turned into a rule that every rep must hit exactly.
Older sales content often repeats a 43:57 “golden ratio.” Gong still references that historical ratio in some product guidance, while its newer research shows a more nuanced picture. The useful conclusion is not that one number is right and the other is wrong. The useful conclusion is that winning conversations tend to create more space for buyer participation, but modern sales managers should coach the quality of the interaction rather than chase one percentage.
How to calculate talk-to-listen ratio
The cleanest calculation uses speaker-attributed speech time. If the seller speaks for 18 minutes and the buyer speaks for 12 minutes, the seller talk share is 60% and the buyer share is 40%. Silence and overlapping speech should be handled consistently by the tool or reporting policy. If one platform counts silence inside total call duration and another does not, the ratios are not directly comparable.
That measurement detail matters because the ratio can be misread. A seller who asks a question and then waits through ten seconds of thoughtful silence may be practising excellent discovery even though silence does not show up as “listening time.” A seller can also hit a low talk ratio by asking weak questions and letting the buyer wander without direction. The metric describes airtime; it does not prove active listening.
Metric 1: Longest monologue
Longest monologue measures how long the rep speaks without a meaningful buyer turn. This is often more coachable than the total talk ratio because it identifies the exact moment where explanation becomes a lecture. A demo may require a higher seller talk share than discovery, but the rep can still pause every minute or two to check understanding, ask a question or invite reaction. Long uninterrupted stretches can signal that the rep is presenting before confirming relevance.
Metric 2: Buyer participation and conversational turns
Count how often the conversation changes hands and whether the buyer contributes substantive information. A healthy discovery call is not a perfectly alternating interview. It is a sequence where the seller asks, the buyer explains, the seller follows the thread, and both parties build on what was said. Buyer participation can be measured through speaking turns, response length or the percentage of the call where the buyer discusses problems, priorities and constraints.
This metric helps separate useful listening from passive silence. If the rep talks only 45% but the buyer gives mostly one-word answers, the low talk ratio is not a victory. The rep may be failing to create relevance or ask questions that unlock detail. Conversely, a slightly higher seller talk ratio can be appropriate if the buyer is engaged, asking questions and requesting explanation.
Metric 3: Question quality, not question count
Question count is easy to track and easy to game. A rep can ask twenty low-value questions and still learn very little. Better sales conversation analytics distinguish between surface questions and follow-up questions that respond to what the buyer just said. The best discovery questions move from situation to impact, priority, process and next action without turning the call into an interrogation.
Weak metric habit |
Better coaching question |
|
“Ask at least 15 questions” |
Did the rep ask a relevant follow-up after an important buyer statement? |
|
“Keep talk ratio under 50%” |
Did the buyer explain the problem, impact and decision context in their own words? |
|
“Avoid long monologues” |
Did the rep pause at logical moments and check understanding? |
|
“Book a next step” |
Was the next step specific, mutual and tied to a date or owner? |
Metric 4: Next-step quality
A sales call can sound balanced and still go nowhere. That is why next-step quality belongs beside talk-to-listen ratio. Look for an explicit action, a clear owner and timing. “I’ll send something over” is not equivalent to “I’ll send the security summary today and we’ll review it with your IT lead Thursday at 2 p.m.” The second close creates mutual commitment and gives the CRM a concrete follow-up event.
Metric 5: Topic balance and buyer-relevant content
Conversation intelligence can also show what the seller talks about. A rep may have a healthy airtime split while spending their speaking time on generic features rather than the buyer’s stated needs. Review whether the conversation covered the buyer’s problem, business impact, decision process, alternatives, risk and next step at the appropriate stage. Topic balance is especially useful when a team follows a defined discovery or qualification methodology.
The right talk ratio changes by call stage
Cold calls are short and seller-led at the beginning because the rep has to establish who they are and why the conversation might matter. Discovery should create more buyer airtime because the goal is learning. Demos naturally require more seller explanation, but strong demos still include frequent buyer interaction. Negotiations can swing in either direction depending on the issue. A single company-wide talk-ratio target ignores these differences and can push reps into unnatural behaviour.
The practical fix is to benchmark by call type. Compare discovery calls with discovery calls, demos with demos and renewal conversations with renewals. Then look for ranges associated with strong outcomes inside your own sales process. External benchmarks are useful for orientation; Your own stage-specific baseline is more useful for coaching.
How to coach with sales conversation metrics
Start with the outcome, then work backwards. If meetings are progressing but discovery scores are weak, inspect whether the call metrics reveal a hidden risk. If deals stall after demos, compare talk ratio, longest monologue, buyer questions and next-step quality across won and stalled deals. Do not show a rep a dashboard with twelve red numbers. Pick the one behaviour that the data suggests is worth listening for in the recording.
For example, a rep with a 67% talk ratio may not need the instruction “talk less.” Listen to where the airtime happens. If the rep spends four uninterrupted minutes explaining the product immediately after the buyer mentions a problem, the coaching action might be: Summarise the problem, ask one impact question, then explain only the relevant capability. The number identifies the pattern; the recording explains the behaviour.
How to connect these metrics to Votelly
Votelly’s current call-analytics and call-centre pages describe real-time analytics, per-agent scorecards, wallboards and coaching workflows, while its sales-team page focuses on dialling, CRM-connected activity and live coaching. That makes this article a natural educational bridge: Explain what conversation metrics mean here, then link readers to Votelly’s analytics, sales-team and call-centre pages for the platform context. Product claims should stay aligned with the live feature pages.
Try this on your own numbers
Local numbers in 118 countries, AI call notes and one shared inbox. Live the same day, no contract.
A practical metric stack for managers
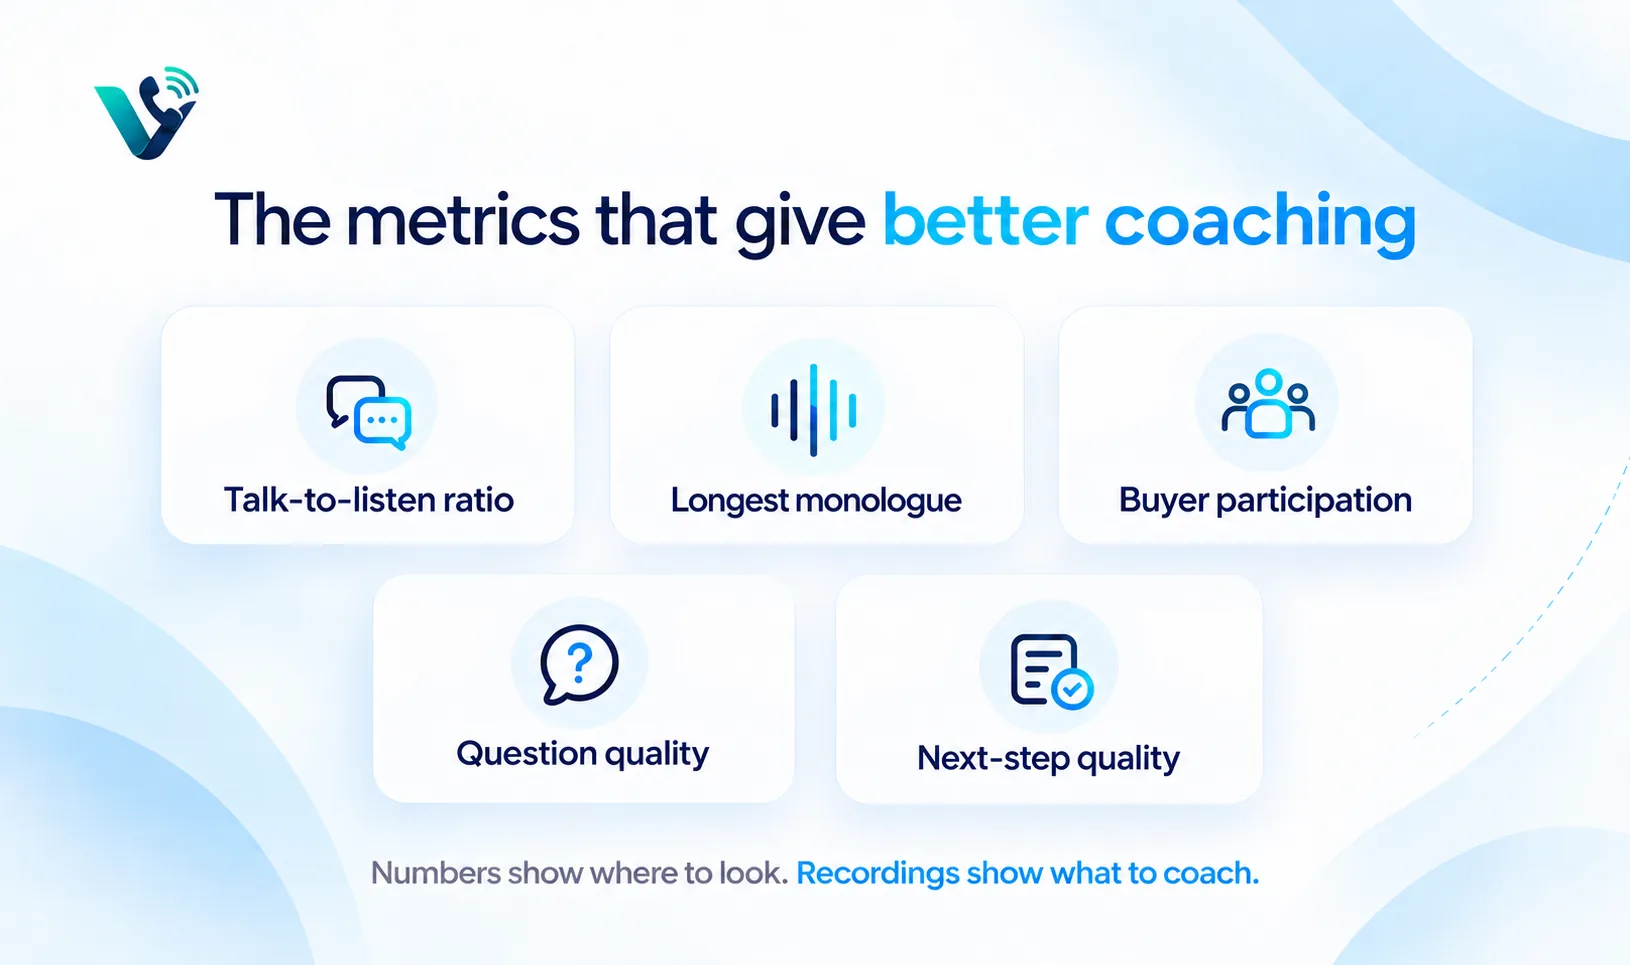
- Talk-to-listen ratio: Use it to flag seller-heavy or unusually seller-light conversations.
- Longest monologue: Use it to find moments where explanation becomes a lecture.
- Buyer participation: Use speaking turns and substantive buyer responses to assess engagement.
- Question quality: Review follow-up relevance instead of rewarding question volume.
- Next-step quality: Check for a specific action, owner and timing.
- Outcome metrics: Compare meetings held, opportunity progression and win/loss patterns without pretending conversation metrics alone cause the result.
One more metric can make the picture clearer: Buyer-question rate. When buyers ask substantive questions about implementation, trade-offs, timing, security, pricing or next steps, they are actively processing the conversation. That does not guarantee a close, but it is stronger evidence of engagement than silence. Track buyer questions by call stage and compare them with progression. A demo with no buyer questions may need different coaching from a discovery call where the buyer speaks often but never asks how to move forward.
The strongest use of talk-to-listen ratio is therefore diagnostic. It tells a manager where to look, not what verdict to deliver. Combine airtime with buyer participation, monologue length, question quality and a real next step, then coach the behaviour visible in the recording. That approach is harder to reduce to one headline number, but it produces more useful sales coaching and a more honest view of what actually predicts progress in a deal.
Frequently asked questions
- What is a good talk-to-listen ratio for sales calls?
- There is no universal target. Gong’s refreshed research found about 57% seller talk on won calls and 62% on lost calls, while the overall average was about 60%. Use stage-specific internal benchmarks rather than forcing every call to one number.
- How is talk-to-listen ratio calculated?
- Divide the seller’s attributed speaking time by total attributed speaking time. Make sure the measurement policy handles silence and overlapping speech consistently.
- Does a low talk ratio mean a rep is a good listener?
- Not necessarily, a rep can talk less while asking weak questions or failing to guide the call. Use buyer participation, follow-up quality and call evidence alongside the ratio.
- What other metrics should managers track?
- Longest monologue, buyer speaking turns, question quality, topic coverage, next-step quality and downstream outcomes such as meetings held or opportunity progression are useful companion metrics.
- Should cold calls and discovery calls use the same target?
- No, different call stages require different levels of seller explanation and buyer discovery. Benchmark talk ratio by call type.
- How can Votelly support sales call analytics?
- Votelly’s current website describes call analytics, scorecards, wallboards and coaching-related workflows. Check the live call-analytics, call-centre and sales-team pages for exact product capabilities.